分位数回归
介绍 #
快手用分位数回归做了一个观看时长的预测方案 Deconfounding Duration Bias in Watch-time Prediction for Video Recommendation。使用分位数避开了时长的连续性与多样性。所以好好研究了一下。
不少文章提到,分位数回归看上去简单,又有点复杂。事实上,是因为现在网上的文章都太理论了,缺乏浅显的实践。直到我看到了最后知乎上的这篇文章 浅显易懂的介绍。
分位数曲线是什么呢?文章举了一个例子,就是儿童成长图(child growth chart)。它给出了儿童(这个表中是男孩)在不同年龄时身高和体重的不同分位数(3%、10%、25%、50%、75%、90% 以及 97%)曲线,这有助于儿医和父母判断宝宝成长过程中发育是否正常。如果一个娃的体重落在 90% 分位线上,说明他的体重比同龄的 90% 的小伙伴要高;如果一个娃的身高或体重在表外了(off the chart),那多半就说明他营养不良或过剩了。
分位数里的几个重要理解,在此记录一下:
- 均值是二阶loss的最优解。中位数是一阶loss的最优解。
- 对于随机变量的样本集Y,τ分位数就是处于整体第τ位置的那个数,排序后可得到,是确定的一个数。
- 分位数回归,实质上就是条件概率分布求解的结果。τ分位数函数是关于X的函数η(X,βτ)。其中τ是超参,βτ仅仅是模型参数,要学习的!!!函数是根据分位数loss优化得到的最优解。当样本足够多时,完全可以看作是,对每一个x,其对应的Yx集合中的第τ位置的那个数的连线。
公式大概是下面这样,其中的ρ有点复杂,见下面的表格。
QY|X(τ)=Xβτ,^βτ=arg minβ∈Rkn∑i=1(ρτ(Yi−Xiβ)).
顺道做个对比:
| 名称 | 优化目标 |
|---|---|
| 均值 | minβn∑i(yi−μ(xi,β))2 |
| 中位数 | minβn∑i|yi−ξ(xi,β)| |
| 分位数 | minβτ∑i:yi≥ξ(xi,βτ)τ(yi−ξ(xi,βτ))+∑i:yi<ξ(xi,βτ)(1−τ)(ξ(xi,βτ)−yi) |
代码实现 #
Python有一个一维的实现。statsmodels是一套统计的数据,自带一套数据engel。模型先把数据载入,使用fit适配指定分位数。
%matplotlib inline
import numpy as np
import pandas as pd
import statsmodels.api as sm
import statsmodels.formula.api as smf
import matplotlib.pyplot as plt

data = sm.datasets.engel.load_pandas().data
mod = smf.quantreg("foodexp ~ income", data)
res = mod.fit(q=0.3)
print(res.summary())
上述代码里的res就是0.3分位数模型了。summary是模型的一些统计信息如下,描述了相关的数据、参数等信息。
                         QuantReg Regression Results
==============================================================================
Dep. Variable:                foodexp   Pseudo R-squared:               0.5708
Model:                       QuantReg   Bandwidth:                       63.86
Method:                 Least Squares   Sparsity:                        242.8
Date:                Mon, 06 Feb 2023   No. Observations:                  235
Time:                        17:23:08   Df Residuals:                      233
                                        Df Model:                            1
==============================================================================
                 coef    std err          t      P>|t|      [0.025      0.975]
------------------------------------------------------------------------------
Intercept     99.1106     17.976      5.513      0.000      63.694     134.527
income         0.4812      0.017     28.760      0.000       0.448       0.514
==============================================================================

The condition number is large, 2.38e+03. This might indicate that there are
strong multicollinearity or other numerical problems.
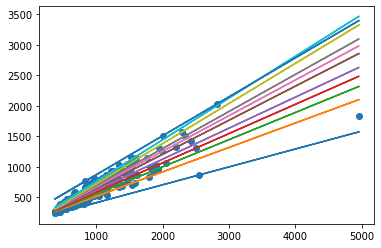
为了展示模型的作用,使用下述代码做了可视化:
quantile = [1e-05, 0.1, 0.2, 0.3, 0.4, 0.5, 0.6, 0.7, 0.8, 0.9, 0.9999]
r = [mod.fit(q=x).fittedvalues for x in quantile]
plt.scatter(data['income'], data['foodexp'])
for res in r:
  plt.plot(data['income'],res)

事实上,fittedvalues里保存的是每一个x样本点对应的y预测值。
关于快手文章中的用法 #
没找到代码,说得也比较模糊。大概的意思就是做了时长的分位数回归,将数据根据时长划到了若干桶里,比均分桶或者直接用时间要好。
参考文献 #
看这篇文章就够了,入门太浅显易懂了,还有关于经典样例“收入-食物”的详细分析。https://zhuanlan.zhihu.com/p/40681570